Wednesday, May 31, 2017

Lab 18 Moment of Inertia and Frictional Torque

Ana Leyva, Jonathan Goei
5/22/17

By doing this experiment we are trying to find the moment of inertia of the system, the frictional torque, and we are trying to use this information to find out how long it would take a car attached to the metal disk to travel a certain distance.
In order to do all of this we first have to measure our apparatus that is made up of three different cylinders. We will use this information to find the moment of inertia of the system. We will then use this information to find the frictional torque acting on the system. However in order to calculate this we first have to find out at what rate the apparatus decelerates at. We will find out the deceleration speed by recording the apparatus as it spins and then using logger pro to see at what rate it slows down. Then using a free body diagram we will calculate the acceleration of the cart as it rolls down a ramp and using this acceleration we will solve to see how long it would take the cart to roll down one meter. We will then check our calculations by doing three trial runs to see if they are close to our theoretical time.

Our Lab set up

The first thing we did to start off this experiment was to measure the diameter and the height of the three connected cylinders that made up our apparatus. We then used this information to solve for the volume of the three cylinders. Which we them used to solve for the mass of those three cylinders. Finally we found the moment of inertia of each of the cylinders and added them up to solve for the total moment of inertia. Then using this information and the free body diagram that we drew we solve for the frictional torque which in turn helped us find a relationship between the apparatus and the acceleration of the attached cart. Finally we used this acceleration to calculate how long it would take the cart to travel one meter down a slope. To confirm our calculated time to travel 1 meter down a slope we then did three trial runs whose time was really close to our calculated time.


Measured values

Deceleration Rate 

Solving for Volume and Mass

Moment of Inertia


Calculating Acceleration and Frictional Torque

Solving for time for the cart to travel 1 meter


As you can observe from the last picture the trial time were extremely close to our predicted time. The reason why they are not perfect can be due to human error in starting and stopping the stopwatch. I believe that this is the main reason why our times aren't exact but other things that might be slowing down our cart could be air resistance and unaccounted friction of the cart going down the ramp. 

Lab 17 Moment of inertia of a uniform triangle

Ana Leyva, Jonathan Goei
5/22/17

By doing this lab we are trying to find the moment of inertia of a uniform right triangle for two different orientations.

We did this experiment two ways we took a theoretical approach to the problem and an experimental approach. For the theoretical approach we used the parallel axis theorem to help us find the moment of inertia around the center of mass. However instead of getting the moment of inertia around the center of mass and then using that to find the moment of inertia around a parallel axis we did it the other way around. We first found the moment of inertia around the edge and then used that to find the moment of inertia around the center of mass. For our experimental approach we used the information from the second part of lab 16 to find the moment of inertia of the apparatus by itself and of the apparatus plus the triangle in two different orientations. We used the same apparatus from lab 16 and logger pro to help us find the average angular acceleration which we then plugged into the equation that was derived for us in lab 16 to help us solve for the moment of inertia. We then used these moments of inertia to help us find the the moment of inertia of the triangles by themselves.

To start of the experimental part of this experiment we first found the angular acceleration of the apparatus without mounting a triangle to it. We then used logger pro to help us calculate the angular acceleration of the apparatus system. We did this because by finding the angular acceleration of the system we can then find the moment of inertia of the system, After finding the values of the apparatus by itself we then mounted the triangle in two different orientations and calculated the moment of inertia for both of those. After gathering that data, we used the formula for the moment of inertia that we had been given in the previous experiment to calculate the moment of inertia of the the system and the triangle plus the system. Once we did that we were then able to subtract the moment of inertia of the apparatus plus the triangle minus the moment of inertia of the apparatus by itself. This gave us the moment of inertia of the triangle by itself.
For the theoretical approach of this problem we first found the center of mass of the triangle. We then found the moment of inertia of the triangle around an edge. We then used this information plus the parallel axis theorem to find the moment of inertia around the center of mass. In order to solve for this we had to first measure the triangle and find the mass of the triangle.

Measured Data
Angular acceleration calculations
Moment of Inertia Calculations
Moment of inertia of the triangles 

Theoretical Approach to find the Moment of Inertia around center of mass

Graphs that helped us calculate angular acceleration


With these previous graphs we were able to calculate the average acceleration of the apparatus and the apparatus plus the triangle placed in two different ways. 

Conclusion: Based on our theoretical and experimental results we did a good job in calculating the moment of inertia both ways. this is because both results were so close to each other. However although they are really close to each other they are not exactly the same this could be due to the frictional torque in the system. You can tell that there is a friction in our apparatus because the acceleration of the mass going down isn't the same as when the mass is going up. The difference in our experimental and theoretical value when the triangle the long side standing was of 0.00005 and when the long side of the triangle was horizontal the difference was of 0.00009 this difference is very small which helps us conclude that our theoretical and experimental values were really close to each other. 

Monday, May 22, 2017

lab 16 Angular acceleration

Lab 16 Angular acceleration Part 1
May 10 & 15, 2017
Ana Leyva and Jonathan Goei

With this experiment we are trying to measure the angular acceleration of an object when you apply a known torque to an object that can rotate.
In order to be able to calculate the angular acceleration we will be using a Pasco rotational sensor which will allow us to get a velocity vs time graph, which will allow us to calculate the angular acceleration as the mass that's attached to the pulley goes up and down. We will also be varying the disks and the pulley of the system in order to see how this affects our angular acceleration. 
To start off this experiment we first measured the mass and the diameter of the hanging mass, steel disks, aluminum disks, and the two pulleys. We then connected our apparatus to our laptop and changed the sensor setting to say that there were 200 counts per rotation. We then turned on the compressed air for our apparatus that would allow the disks to rotate separately. We then wrapped the string that was attached to our hanging mass around the torque pulley. We then started collecting data on logger pro and released our mass simultaneously. We did this experiment six times and varied the hanging mass the torque pulley and the disk. We did this experiment multiple times in order to look at the effect that these changes had on our angular acceleration. Once we dot the data for these experiments we looked at the velocity vs time graph that was produced. We then took the slope of the graph when the mass was going up and when it was going down. The slope of the velocity vs time graph gave us the angular acceleration of the system as it went up and down. We then took the average of the angular acceleration for each experiment. We compared experiments 1,2, and 3 in order to see the effect of the hanging mass. Experiments 1 and 4 show us the effect of changing the radius. Finally, comparing experiments 4,5, and 6 will show us the effect of changing the rotating mass.
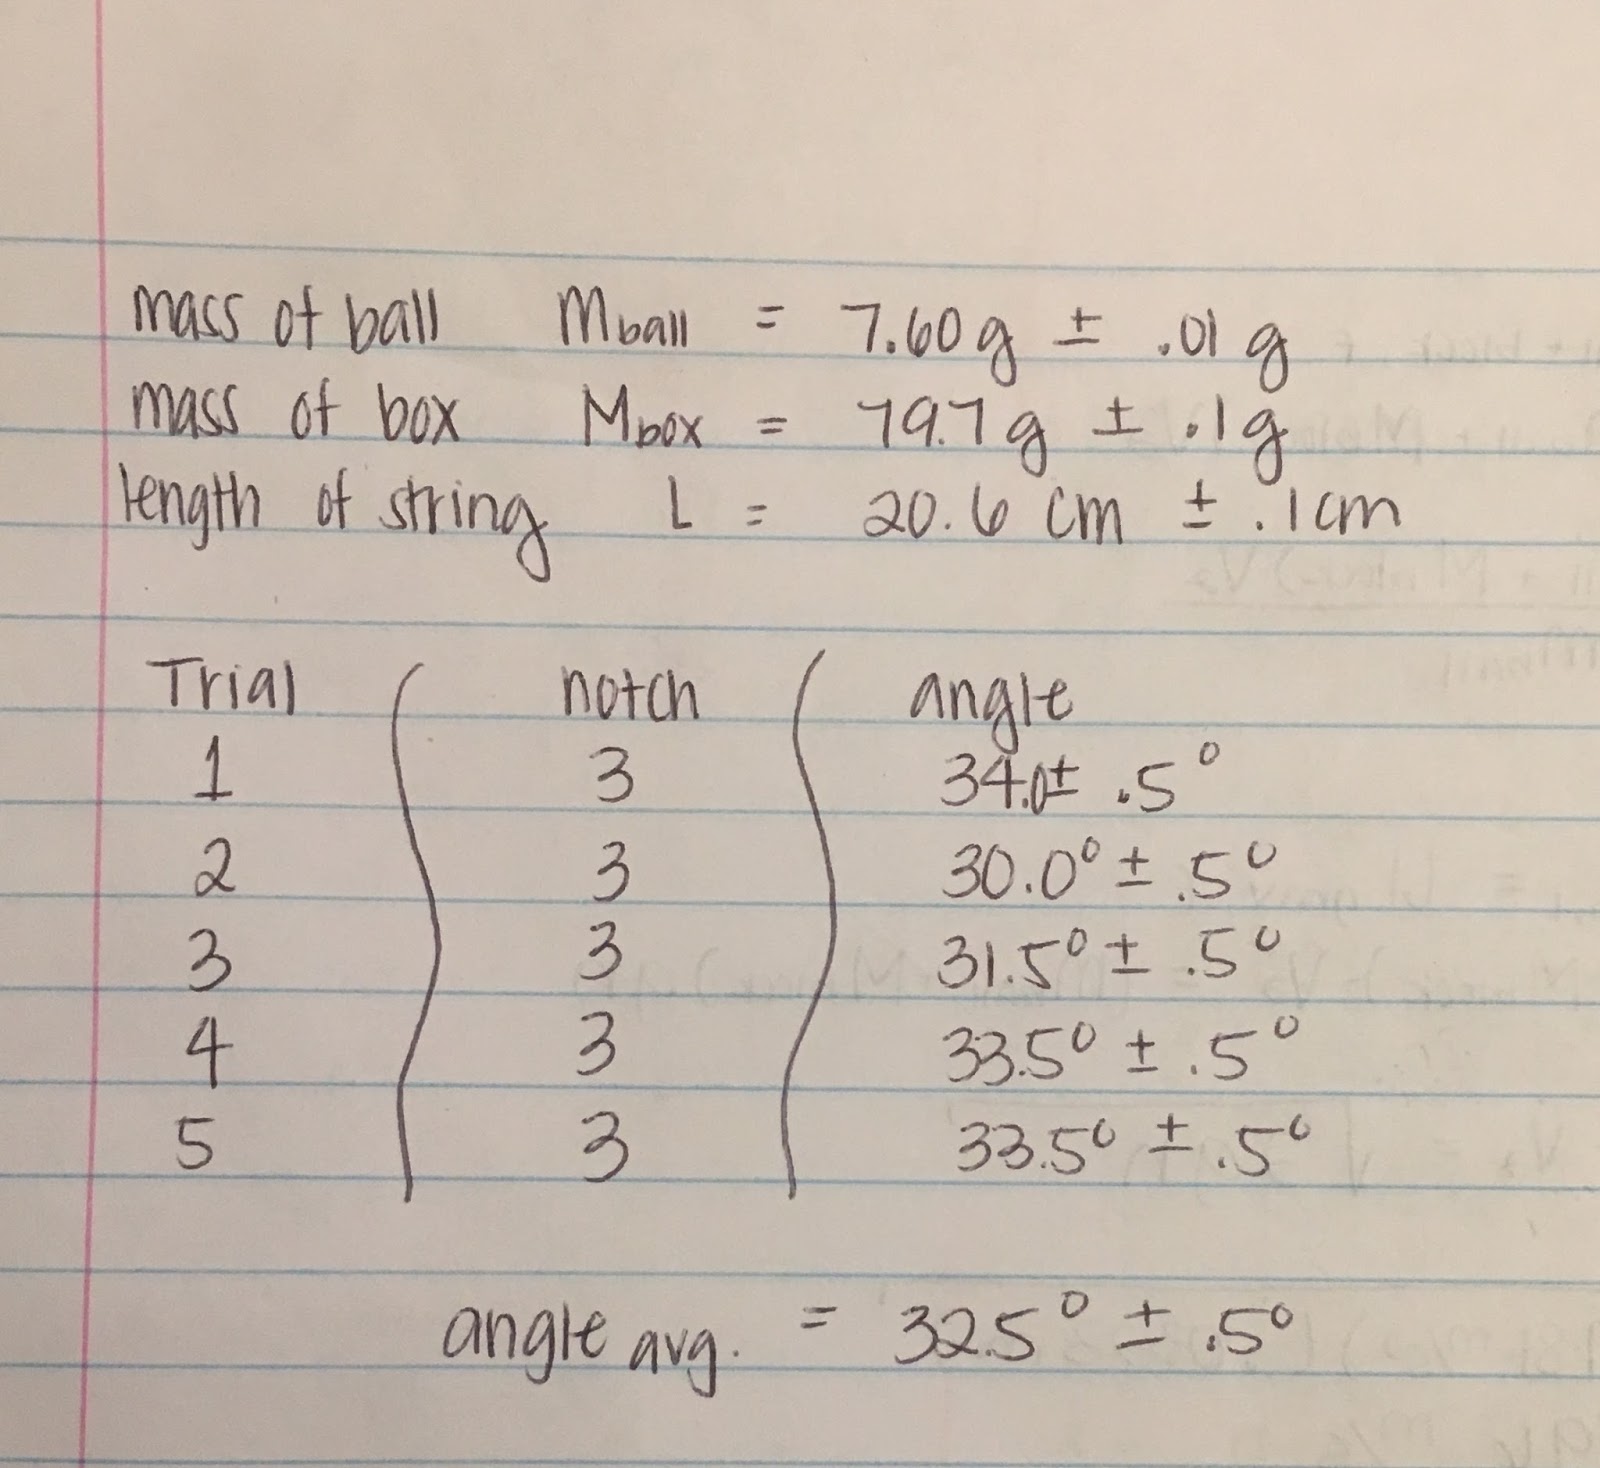

Measured Data


Graphs
Experiment 1

Experiment 2

Experiment 3

Experiment 4

Experiment


Experiment 3


From our graphs and calculated results we can see that when you increase the hanging mass the angular acceleration increases. In our case the angular acceleration changed in proportion to how much mass we added. Therefore when we doubled our mass our angular acceleration doubled and when we tripled our mass our angular acceleration also tripled. When you change the radius of the pulley there is a slight increase in the angular acceleration. Finally when you change the rotating mass there is an increase in the angular acceleration when there is a smaller rotating mass and a decrease in angular acceleration when the rotating mass is heavier. 

Part 2. 
In this part of our experiment we will be using the data that we gathered in the first part of this experiment to calculate the moment of inertia of each of the disks and disk combination. 
For this experiment the equation that we need to calculate the moment of inertia was derived for us. 
To be more specific we will be using the hanging mass and radius of the disks and the calculated angular acceleration to calculate the moment of inertia. 


After calculating the moment of inertia we got results that make sense. The moment of inertia for the first three experiments are relatively close to each other which is something that we expected because the disk is the same for these three. I believe that the all of the moments of inertia are reasonable. Some of the sources of uncertainty in our experiment was that the air pressure wasn't always the same for our different experiments this might be one of the reasons why are results aren't completely perfect. Another source of uncertainty might be that we forgot to clean the disks before we started collecting our data which might also have caused more friction than we intended their to be.

Wednesday, May 10, 2017

Ballistic Pendulum Lab

May 1,2017
Ana Leyva, Jonathan Goei
The purpose of this lab was to determine the firing speed of a ball from a spring loaded gun, However since we don't have anything to help us determine the speed of the ball, we will have to calculate this using thing that we were able to calculate such as the height to which the ball rises, and the angle to which it rises.

There were two parts for this experiment in the first part we calculated the angle to which our box went to when the ball was fired. For the second part we used our calculated velocity to figure out how far away our ball would land if we were to shot it and there was nothing to stop it.
For the first part we started off by measuring the mass of the ball and the block. Then we leveled the base of the apparatus and we leveled the hanging block. We then got ready to fire the ball by pulling back the notch to the third position. We then made sure that the angle indicator was at zero degrees and then we pushed a lever that released the ball and fired it into the block. We then repeated this four more times in order to get 5 different angles that were hopefully close to each other. We then got these angles and got an average. After this we did some calculation that helped us determine the speed at which the ball was fired. In order to do this we first had to think about the conservation of momentum in inelastic collisions in order to find a way to calculate the velocity at which the ball was fired. We did this by first taking in to account the momentum from when the ball is fired to the time when the ball hits the block. We then used the law of conservation of energy which helped us calculated the velocity of the block and ball as it was rising. In order to figure this out we fist needed to find out the max height that the block reaches. We found this out by using the length of the stings that suspended the block and the angle to which it rose. This height allowed us to find the velocity of the box and the ball together which in turn helped us find out the initial speed of the bullet.

Measured Data


Calculated Data and Propagated Uncertainties 


In conclusion our calculation were off even when we took into account the uncertainties in our calculations. This could be due to many outside factors like the movement of the table when we were doing the experiments. It could also be due to the fact that maybe our apparatus wasn't as leveled as we thought it was. Then there is always human error maybe we didn't measure things as closely as we thought we did.